Google Analytics 4 (GA4) is a service that allows you to measure user traffic and engagement across both sites and apps. Google introduced this analytics platform in October 2020, replacing the former "App+Web" property. In addition, the search engine giant intends to make GA4 the default service of this kind, retiring the Universal Analytics properties, which will stop registering hits starting on July 1, 2023.
Universal Analytics focused on hit types, like page views, user timing, visits from social media, events, transactions, etc. Google Analytics 4 records every user interaction with a page or an app as an event. Also, unlike Universal Analytics properties, GA4 does not display Category, Action, and Label for events.
Another significant difference is that Google Analytics 4 detects user activity automatically, whereas Universal Analytics relies on manual instrumentation. You can find several other differences on this page, which is part of your learning curve if you want to familiarise yourself with Google Analytics 4.
GA4 is the next generation of Google Analytics, built to adapt to ever-changing user privacy protocols, regulatory developments, and consumer expectations.
The new service uses machine learning to offer webmasters and app owners essential and helpful user insights that help them understand how consumers access information across devices and platforms. For example, GA4 can help you:
- Understand how your customers interact with your website and apps.
- See which of your pages or products are the most popular due to new consumer needs.
- Anticipate future consumer actions on your site or app.
- Calculate churn rate probabilities to understand why some consumers spend more than others or stop subscribing to a service.
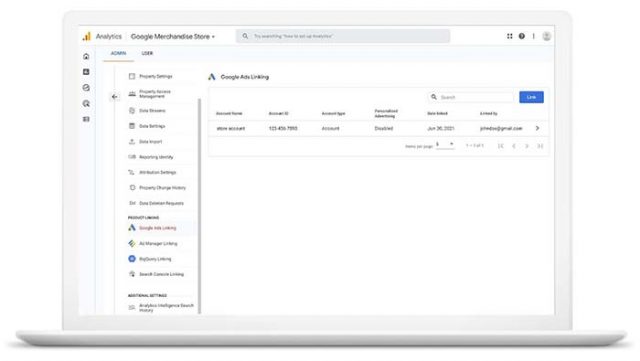
GA4 also integrates with Google's advertising platforms, including Google Ads Links, Ad Manager Links, BigQuery Links, Display & Video 360 Links, Merchant Center, Search Ads 360 Links, and Search Console Links. This integration will help you create audiences that reach your potential clients with better ad experiences, thus maximizing your marketing decisions and ROI.
Google Analytics 4 Reports
Another advantage you have with GA4 is the Realtime report, which shows you - per minute - the number of users that visited your site in the past 30 minutes. You will see where the users are coming from, who they are, what content they browse, which events they trigger, and which conversions they complete. Use the Realtime reports to monitor the immediate effects on traffic from a blog post, tweet, or how updated content affects the traffic on your site.
With GA4 Acquisition reports, you'll see where your users come from, whether from Google Search, Social, Google Ads, or other platforms. You can also monitor:
- The user activity in the last 30 minutes.
- New users by First user default channel grouping (include all traffic sources, paid, organic, social, email, and others).
- Sessions by Session Google Ads campaign.
- And the Lifetime value chart, which illustrates the average revenue from new users over their first 120 days.
Engagement reports help you understand how users interact with your sites and apps with metrics triggered by the user engagement event. For example, you can see the average engagement time on your platform for a specific timeframe (typically the last 28 days if you don't select a different period). Other metrics in the Engagement overview include:
- engaged sessions per user;
- average engagement time per session;
- user stickiness - a comparison between daily active users, weekly active users, and monthly active users;
- automatically collected events (language, page_location, page_referrer, page_title, screen_resolution) and enhanced measurement events enabled by the webmaster in GA4;
- conversions, which are essentially the events you deem conversions like purchases or app_store_subscription_convert, and you must set them up manually with the correct parameters recommended by Google;
- Website pages, with the HTML title tag of the web page that the user visited, and screens from your apps, using the UIViewController from your iOS app or the Activity from your Android app.
The Monetization reports show you the revenue you generate from your products, services, ads, or subscriptions on your website or app. You will also see a section with Ecommerce purchases, In-app purchases, and the Publisher ads section, which only shows the revenue you generate from the ads in your mobile app and is not currently available for websites.
The Retention reports are valuable because they show you the user retention by cohort. Cohorts are groups of users who share common characteristics identified by an Analytics dimension. Use these reports to understand what makes certain users engage with your site, the percentage of users who return every day, the sum of purchase events for the past 120 days, etc.
The Demographics reports are straightforward: you will be able to see who your users are, based on location, language, gender, age, and interests triggered by their online browsing and purchase activities. Tech reports also show you what type of device the site or app visitors used to access your content: mobile devices, desktops, tablets, etc.
These are the main reports in the new Google Analytics 4. They will offer you a better understanding of your customers and their behaviours and data that will help you refine your digital marketing strategies in the long term.
Universal Analytics relied on cookies, while Google Analytics 4 doesn't really need them because it uses an event-based data model and operates across platforms. So, you should adopt Google Analytics 4 as soon as possible because Universal Analytics will stop processing new hits in July 2023, and you may lose essential historical data that helps your long-term marketing strategies. Visit Analytics Help to learn how to get started.